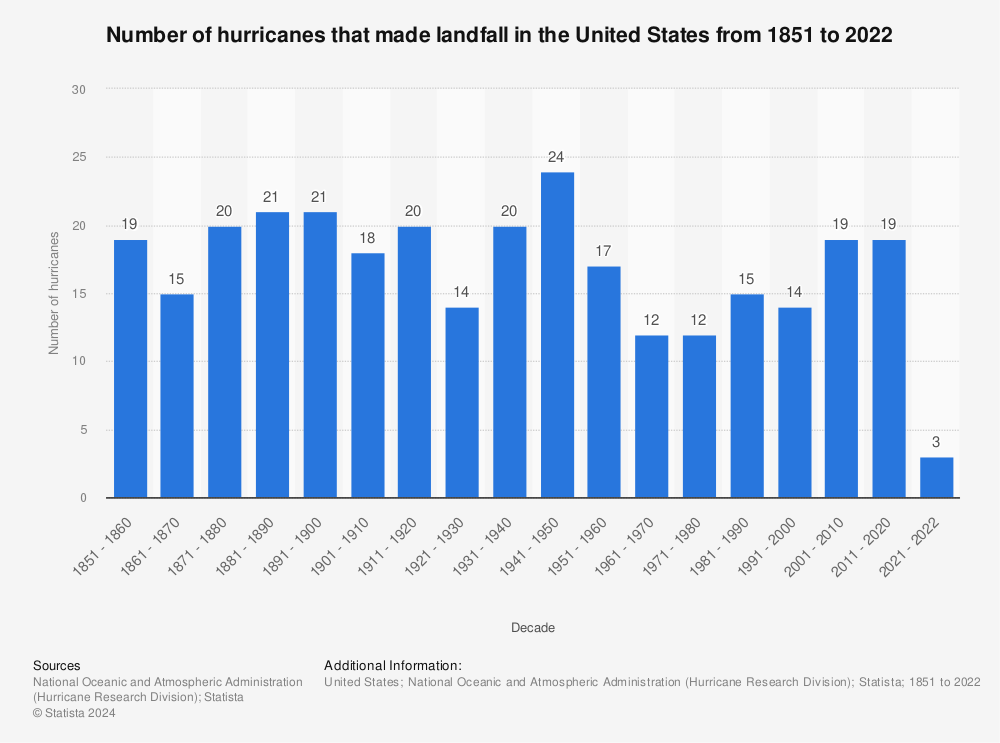
There are a number of things you can do on the chart page, though some option availability depends on the source:
 Find more statistics at Statista (must be on campus or login with your COM account for off campus access).
© 2024 COM Library
1200 Amburn Road, Texas City, Texas 77591
409-933-8448 . FAX 409-933-8030
This work is licensed under a Creative Commons Attribution-NonCommercial 4.0 International License